AI Writes Code 3x Faster. Your Team Spends 2x Fixing It


Here's a scenario for you:
Your AI adoption business case projects a 5-10x productivity gain. So your team rolls up their sleeves and gets to work. Yet, when you look at the results, your engineering team delivered a 2-3x gain instead and spent the difference debugging code that compiled perfectly and failed in production.
We know it sounds familiar. It happened to us too.
So we found out why.
We tracked both numbers across seven production projects, and the gap between the vendor pitch and the production data is where most organizations misallocate engineering capacity.
When our team analyzed the commit history across seven of our AI-assisted production projects (200+ commits across 10 repositories, roughly 150,000 lines of code) a pattern emerged, and nobody in the AI productivity conversation is addressing it: every AI-generated feature carries a rework cost that doesn't appear in any vendor demo or adoption business case.
This is the first article in our AI Engineering in Practice series, where we share what we've measured across real production projects. In this piece, we cover:
- The Vendor Pitch vs. the Production Data : what the industry reports vs. what our commits show
- Why Every AI Feature Needs a Fix Cycle : the pattern behind structurally correct but environmentally naive code
- Why Vendor Metrics and Production Metrics Diverge : why both sides are right, and what it means for planning
- What This Costs at Team Scale : the rework multiplier most business cases miss
- When the Rework Ratio Compresses : how process investment changes the curve
- What to Measure Instead : three metrics that survive a board conversation
- Where the Competitive Advantage Actually Lives : what differentiates teams using the same models
The Vendor Pitch vs. the Production Data
The AI adoption pitch is certainly compelling!
The biggest names in AI-assisted engineering are reporting transformative numbers:
- David Crawshaw reports that AI writes 90% of his code
- a16z values the AI software development market at one trillion dollars
- Cursor reached $500M in annual recurring revenue in 15 months
- The YC CEO ships 4,000-line features in an hour
These numbers are real. We've experienced the same acceleration across our projects. But they measure generation speed, the first half of the delivery cycle.
Here's the second half, from our production data:
AI writes 90% of the first draft. Your team debugs 50% of it. That's still faster than manual, but it's not the number in the vendor deck.
The infrastructure projects are the starkest example.
In one of our infrastructure automation projects, across 21 commits, 57% were fixes for issues the AI could not have anticipated: network resolution differences between IPv4 and IPv6 on the target server, container naming conflicts from previous deployments, and special characters in database credentials breaking URL parsing.
Why Every AI Feature Needs a Fix Cycle
AI generates structurally correct code that is environmentally naive.
The AI produces code that passes every static check (syntax, formatting, type correctness) and then fails on contact with a real server, a real database, or a real deployment pipeline.
This is the fundamental pattern across all seven projects we analyzed.
We've seen it in one of our projects. An infrastructure automation project made this pattern unavoidable, with 8 critical production failures, each discovered only after deployment:
- API validation rules that differed from documentation
- Architecture mismatches between the build environment and the target server
- Credential formats that broke during shell processing
- Service health checks that passed locally but failed inside containers
None of these are bugs in the traditional sense. The code was correct in isolation and it was wrong in context. Every failure required a human to deploy, observe, diagnose, and fix, a cycle that averaged 30 minutes to 2 hours per incident.
57% of our infrastructure commits were fixes. Not because the AI wrote bad code, but because it wrote code for servers it had never connected to. Every enterprise has infrastructure the AI has never seen.
The same pattern appeared at the application layer. A payment integration landed in a single feature commit. Over the following three days, four fixes followed:
- Hardcoded URLs that broke in production
- UI components that failed during live transaction flows
- Missing environment-specific configuration
- Error handling gaps that only surfaced with real payment processing
The AI wrote working payment code, for a development environment.
So why does every AI feature need a fix cycle? Because AI models generate code from patterns, not from production context. They've never connected to your servers, never seen your deployment pipeline, never observed how your services actually behave under load. The fix cycle isn't a failure of the tool. It's a structural gap between what the model knows and what your environment requires. The organizations closing that gap fastest are the ones encoding production lessons back into their AI workflows, through instruction files, pre-commit validation, and systematic failure capture. We'll show how later in this piece.
Why Vendor Metrics and Production Metrics Diverge
When evaluating AI coding tools, engineering leaders encounter two seemingly contradictory data points:
- Industry practitioners report that AI writes 80-90% of their code.
- Our production data shows 30-57% of commits are rework.
Both numbers are accurate. They measure different stages of the same delivery cycle.
- The industry figures measure generation: first drafts, initial implementations, code that exists.
- Our figures measure the full cycle from feature start to production-stable, including every fix commit required to make the generated code actually work.
This distinction matters for capacity planning.
A Harvard Business Review study of 200 employees at a US tech company found that AI tools don't reduce engineering effort. They redistribute it. Engineers manage more parallel workstreams, but spend proportionally more time reviewing, validating, and correcting AI output.
Simon Willison, one of the most experienced AI-assisted engineering practitioners, describes the cognitive load directly: "after just an hour or two my mental energy for the day feels almost entirely depleted."
Any AI adoption model built on generation-speed metrics alone will underestimate the engineering capacity required by 40-60%.
What This Costs at Team Scale
For a 10-person engineering team adopting AI coding tools, the rework cost becomes a capacity planning problem.
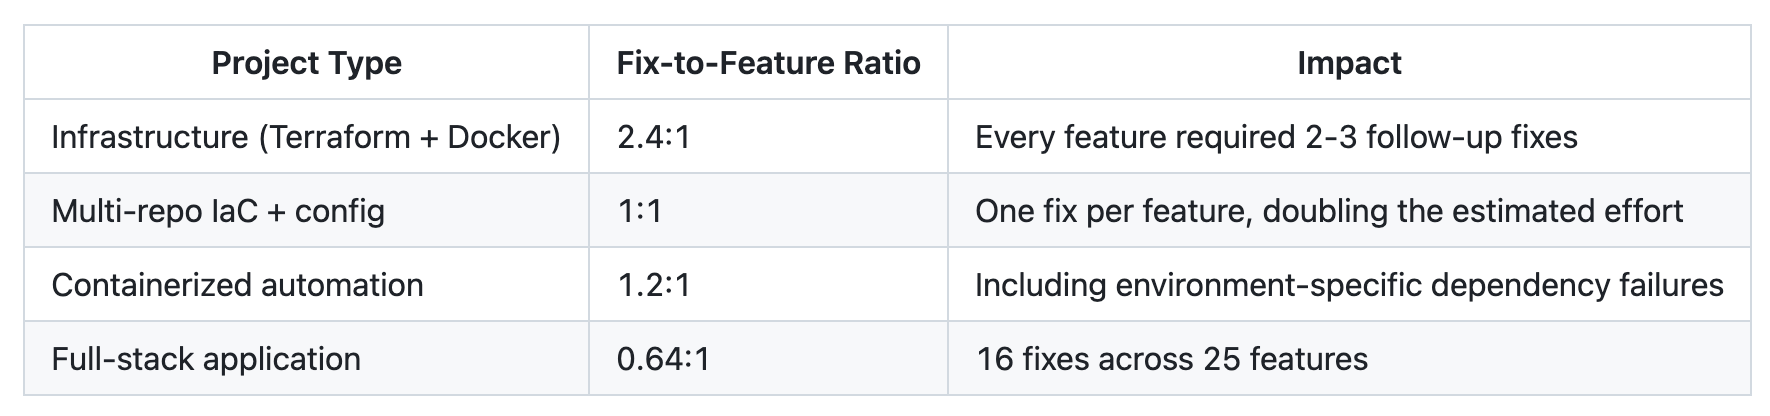
Our data shows each AI-assisted feature generates 0.6 to 2.4 follow-up fix cycles, depending on project type. While infrastructure code sits at the high end, application code sits at the low end. Across a blended team, that averages to roughly 1.0 fix cycle per feature.
A team shipping 50 features per sprint generates approximately 50 follow-up fix cycles. Each fix cycle averages 30 minutes to 2 hours: deploy, observe the failure, diagnose, fix, redeploy. At one hour average, that represents 50 engineer-hours of rework per sprint that doesn't appear in the adoption business case.
If your AI adoption business case doesn't include a rework multiplier, you're underestimating engineering costs by 40-60%. The tools are fast. The fix cycles are where the budget actually goes.
Consider StrongDM's approach: a three-engineer AI team spending approximately $1,000 per engineer per day in token costs alone. Their operating principle is radical: "code must not be written by humans" and "code must not be reviewed by humans." But that only works because they've invested proportionally in validation infrastructure. They built a Digital Twin Universe (DTU): behavioral clones of third-party services like Okta, Jira, Slack, and Google Docs that replicate APIs, edge cases, and observable behaviors. QA agents continuously run thousands of scenarios per hour against these digital twins, without hitting production rate limits. Instead of traditional pass/fail tests, they measure "satisfaction": what fraction of observed trajectories through scenarios likely satisfy the user. The visible cost is the tooling. The real cost is the validation apparatus required to trust the output.
Most enterprise adoption business cases include tool licensing and project the generation speed. They don't include the rework multiplier. For infrastructure projects, that multiplier is 1.5-2.4x the generation estimate. For application code, it's 0.6-0.8x. These are measured figures from production projects with commit-level timestamps.
When the Rework Ratio Compresses
The fix-to-feature ratio is not fixed. It compresses, significantly, with deliberate process investment.
The clearest evidence comes from a full-stack application project. Before a structured AI instruction file was introduced the project experienced migration cascades, inconsistent patterns, and infrastructure churn.
Our team then introduced an instruction file containing:
- architecture decisions
- naming conventions
- known failure modes
- deployment workflow
After the instruction file was added, output quality improved immediately and remained consistent across every subsequent session.
The cost curve tells the same story.
Features 1 through 10 averaged roughly 12 hours from start to production-stable, including all rework. Features 40 through 50 averaged approximately 4 hours. That represents a 3x cost reduction, driven not by model improvements, but by accumulated context that prevented the AI from repeating known failures.
Pre-commit validation proved equally critical.
Projects with automated secret-scanning hooks had zero credential leaks across 960 lines of configuration code. A project without that automation exposed test credentials on a production-facing page. AI treats secrets as ordinary strings unless the process infrastructure explicitly intercepts them.
Budget 40-60% more engineering time per AI-assisted feature than the generation estimate alone. That's the honest number. It's still faster than manual. It's not free.
One infrastructure automation prompt grew to 919 lines across 8 production failures. Each failure was diagnosed in production, and the lesson was encoded back into the AI's instructions.
This is the compounding mechanism: every production failure, properly captured, reduces the probability of the next one.
Organizations that systematize this feedback loop see their rework ratio compress. Organizations that don't pay the same learning tax every sprint.
What to Measure Instead
If the rework ratio is the real signal, most organizations are tracking the wrong dashboard. Three metrics survive a board conversation:
- Fix-to-feature ratio by project type.
- Track fix commits per feature commit.
- Above 1:1 means the AI is generating more rework than value.
- Below 0.5:1 is healthy.
- Below 0.3:1 means process investments are compounding
- Segment by project type:
- infrastructure consistently runs 2-4x higher than application code.
- Track fix commits per feature commit.
- Time-to-production-ready. Measure from feature start to the commit where it works in production, including all fixes. This number reflects real delivery speed.
- Rework trajectory.
- Is the fix ratio improving over time?
- If features 1-10 cost 12 hours and features 40-50 cost 4 hours, the investment is compounding.
- If the ratio is flat, the team is not encoding what it learns, and is paying the same rework cost every sprint.
- Is the fix ratio improving over time?
These are the metrics that indicate whether an AI adoption investment is delivering returns.
Lines generated, tokens consumed, and "percentage AI-written" have no correlation with production delivery.
Where the Competitive Advantage Actually Lives
AI-assisted development is 2-3x faster than manual. That is the measured result across seven production projects. Not 10x.
These results are not the order-of-magnitude improvement in vendor pitch decks. But significant enough to be a competitive requirement: teams that don't adopt will fall behind on delivery speed.
The strategic question is not whether to adopt, it's where the advantage compounds.
From the seven production projects we analysed, a full-stack application went from first commit to production in 24 days, and an infrastructure automation tool reached working product in 3 days. That delivery speed is transformative.
But every team using the same AI model has access to the same generation capability. The differentiator is not the model. It is the process infrastructure that determines how much of that generated code actually ships.
Organizations that invest in structured instruction files, pre-commit validation, and systematic failure encoding will see their rework ratio compress from 2.4:1 toward 0.3:1.
Organizations that treat AI adoption as a tooling decision, without redesigning their engineering process, will pay 40-60% more than projected, every sprint, indefinitely.
Every team has access to the same AI models. The competitive advantage is in the process infrastructure that determines how much generated code actually reaches production.
The acceleration is real. The cost is real. The organizations that measure both will outperform those that only measure the first.
What Comes Next
The cost of AI-generated code is measurable. We've shown that across seven projects and 200+ commits. But cost alone doesn't tell you whether the investment is working.
The next piece in this series introduces the three enterprise quality metrics our team tracks across every AI-assisted project, including the security metric that most organizations discover only after a production incident lands on the CISO's desk. Cost tells you what you're spending. Quality tells you what you're getting.
If your organization is navigating AI adoption and the numbers in your business case don't match production reality, we've been through this transition across multiple projects and teams. We'd like to help.
Reach out at contact@xgeeks.com to talk about what your engineering data is actually telling you.